
2022 A Strong Sales Year
For the third year in a row San Miguel County saw over a billion dollars in real estate sales, but as the year drew to a close we started to see changes in our market and 2022 ended up behind the past two years in both dollar volume and number of sales. 2022 was down from the record-breaking 2021 by 22 percent in dollar volume (with $1,106.50 vs $1423.62 billion) and 38 percent in number of sales (582 vs 944). That said, the 2022 dollar volume was up 27 percent over the prior 5 year average while the number of transactions was down 15 percent over the same time frame.
December was particularly slow with just 16 sales and $29.79 million in dollar volume and two sales (one at $9.5million and one at $10.25 million) made up 66 % of the sales volume for the month. After several years of an unambiguous Seller’s market, 2023 could be different. Would-be buyers could be priced out by rising mortgage rates, presenting opportunities for all-cash buyers.
Despite the national headlines about mortgage rates and other factors all real estate is local. Limited inventory (a common refrain from the past few years) has kept prices stable.
Another Record-Setting Year in 2021
Like many resort communities we saw a continuation of the trends that started in 2020 as more people realized they could work remotely. With our stunning views, countless outdoor activities, wide variety of cultural offerings and excellent restaurants, Telluride has always provided an exceptional quality of life and people continued to take advantage of this by securing their own home in the mountains.
According to Telluride Consulting, San Miguel County closed the year with $1.4 billion in sales and 944 transactions. This was a 23 percent increase in dollar volume over 2020’s previous record of $1.1 billion and a 16 percent increase in number of sales.
There were a total of 65 sales over $5 million in 2021, an increase from 48 in 2020. Of these 11 were over $10 million. The Town of Telluride saw a decrease in single family home sales in 2021 but a large increase in the average sales price, driven primarily by limited inventory. Inventory limits also drove up prices in the Town of Mountain Village and these same limits continue to drive pricing as we start the new year.
2020 – Into the Billions
The total dollar volume of sales in San Miguel County in 2020 set an all-time record with $1.16 billion in sales, which is a 54 percent increase from the previous all-time high set in 2007 ($756.6 million). The number of transactions in 202 totaled 814, compared to 631 in 2007, which is a 29 percent increase.
Overall San Miguel County saw a boom in real estate sales throughout the COVID-19 pandemic in 2020. This caused prices to spike, inventory to plummet, and the average time on market to shorten significantly. The average sales price in the County climbed 30 percent in 2020 to $1.43 million compared to $1.1 million in 2019.
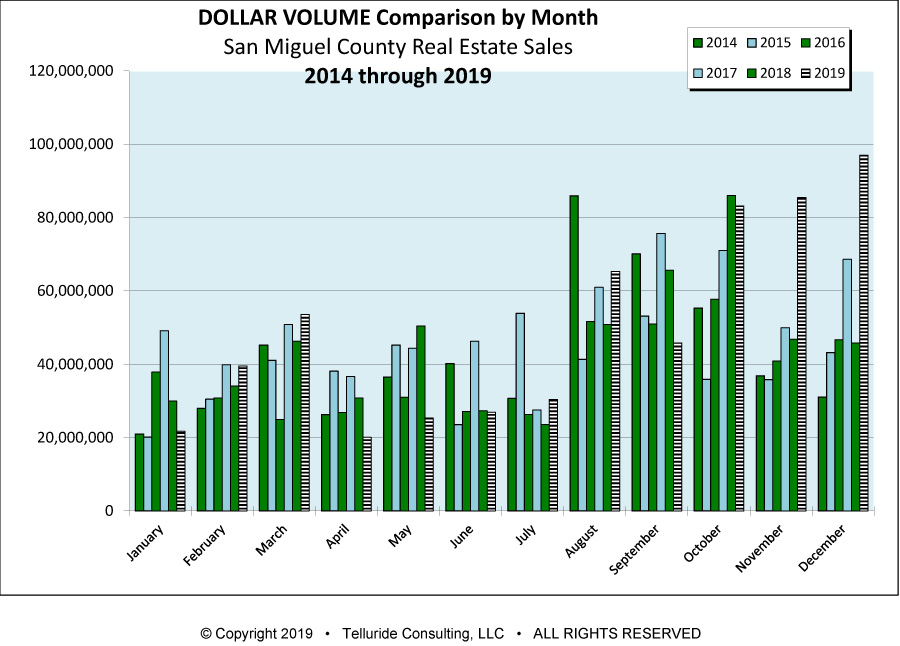
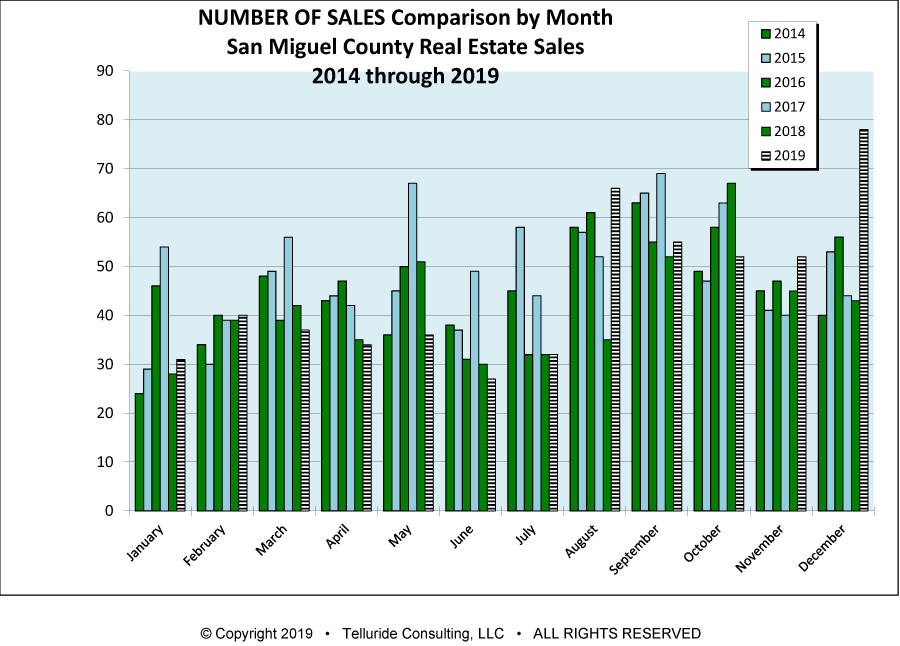
Continued Growth in 2019
Sales in San Miguel County finished 10.6% ahead of 2018 in dollar volume and up 8.2% in number of sales. Countywide we recorded $594.3 million in sales and 540 transactions. This was just a bit below 2017’s $621.1 million in dollar volume with significantly fewer sales (540 vs 619). The strong finish to the year was boosted by year-end closings and December was the largest dollar volume month in County history at $96.9 million.* Generally speaking 2019 continued the trend of higher prices per square foot for properties. Comparing dollar volume in 2019 ($594.3 million) to the prior 5-year average ($516 million) also indicates an upward trend and steady growth.
Overall change in dollar volume for San Miguel County
Overall change in number of sales for San Miguel County
Change in Dollar Volume/Sales for Mtn. Village
Change in Dollar Volume/Sales for Telluride*
Change in Dollar Volume/Sales for remaining County
10.6%
19.9%
18.6%
-16.4%
8.2%
7.7%
24.1%
-5.6%
Once again, the single largest number of sales in 2019 was in Town of Telluride condominiums with 95 closings. This was also the segment of the market that generated the highest dollar volume of sales with $129.2 million. The second highest dollar volume was in sales of Mountain Village single family homes where 27 properties traded for $117.6 million while the third strongest segment of the market was Mountain Village condos with 76 sales and $94.3 million in dollar volume. Again, this is a bit of a change from recent years in which Mountain Village condominiums had represented the largest number of sales and dollar volume. Diving a bit more deeply into single family home sales, 2019 saw 27 homes trade in Mountain Village for $117.6 million, up from 24 with a total value of $69 million in 2018. In the Town of Telluride we saw 20 homes sell for $56.3 million, down nine from the 29 sales totaling $87.4 million in 2018. Looking at condominiums there were 95 sales in Mountain Village for a total of $129.2 million (up from 84 and $96 million in 2018) while Telluride saw 76 sales and total sales volume of $94.3 million (down from 84 and $96 million in 2018). Overall 2019 number reflect continued growth with steady increases in values and price/sq. ft. in homes and condos. In the Town of Telluride in particular these price increases have been driven by tight inventory. *December’s number of sales included 19 new construction deed restricted sales in the Town of Telluride at the new Longwill 16 and Silverjack projects. **All numbers from Telluride Consulting
2018 Another Strong Year for San Miguel County
Real estate sales in San Miguel County finished 2018 a bit behind the record setting pace of 2017, off 13% in dollar volume and 19% in number of sales. All told the county recorded $537.5 million in sales and 499 transactions. Looking back over the last 10 years this dollar volume was higher than all but 2017’s $537.5 million but the number of sales in 2018 lagged behind 2014-2017. Generally speaking 2018 saw higher prices per square foot for properties, particularly in the Town of Telluride where inventory is tight, and the decrease in numbers of sales can be partially attributed to a lack of compelling inventory. Interestingly, the single largest number of sales in 2018 was in Town of Telluride condominiums with 89 closings. Mountain Village saw 84 condominium sales. This is a bit of a change from recent years in which we have seen the highest number of sales in Mountain Village condominiums. The highest dollar volume of sales was in Mountain Village condos at $96 million while Town of Telluride condo sales accounted for $83.2 million in sales. In single family home sales Mountain Village had 24 home sales for $69 million, down from 28 for $101 million in 2017. The Town of Telluride saw 29 transactions for $87.4 million, down just one from 30 in 2017 but up almost $4.5 million in dollar volume, from just under $83 million in 2017 to
$87.4 million in 2018. Finally, county wide sales were up by 9% in dollar volume but off 20% in number of sales. A lot of this was driven by some significant sales of ranch and regional properties.
2017 Sets New Highs in Number of Sales and Dollar Volume
In 2017 real estate sales in San Miguel County set new highs in both number and dollar volume of sales over the past 10 years with $621.1 million in dollar volume and 619 total sales. The only years with greater dollar volume were 2005, 2006 and our all-time record setting year in 2007. According to Telluride Consulting overall dollar volume for San Miguel County was up 36% over 2016 and up 10% in number of sales. Dollar volume for Mountain Village was up 49% and number of sales up 5% while these statistics were up 26% and 28% respectively for the Town of Telluride. These increases were fueled by more home and condo sales with single family home sales increasing from 28 totaling $64.3 million in 2016 to 30 and $83 million in dollar volume in 2017. Condominiums saw similar increases going from 78 to 102 sales on dollar volumes of $71 million and $86.1 million respectively. Generally speaking as the market in the Town of Telluride tightened prices increased accordingly.
2002
2003
2004
2005
2006
2007
2008
2009
2010
2011
2012
2013
2014
2015
2016
2017
2018
2019
2020
2021
2022
$319.2 million
$433.1 million
$617.0 million
$724.5 million
$681.9 million
$756.6 million
$343.2 million
$265.7 million
$317.6 million
$247.4 million
$364.7 million
$342.2 million
$507.1 million
$461.8 million
$452.8 million
$621.1 million
$537.5 million
$594.3 million
$1161.70 billion
$1423.62 billion
$1106.05 billion
666
748
855
883
709
631
339
276
327
383
444
410
523
555
562
619
499
540
814
944
582
The graph above is from data taken from county records and represents all sales in the county in each given year, not just Multiple Listing transactions, and was created by Telluride Consulting, a local firm that has tracked real estate sales in San Miguel County since 1985.